The Analysis window is where new analyses are created, existing analyses modified and, optionally, the open analysis is run. This window is only available to those with a school level role, with the permission Administer Analyses in the Security window, when they are logged into the Accelerus database.
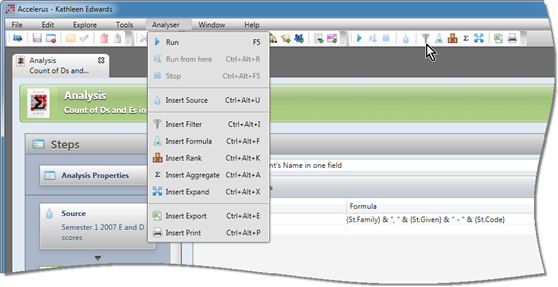
When this window is open an Analyser menu becomes available, as well as a toolbar with icons for the main Analyser options.
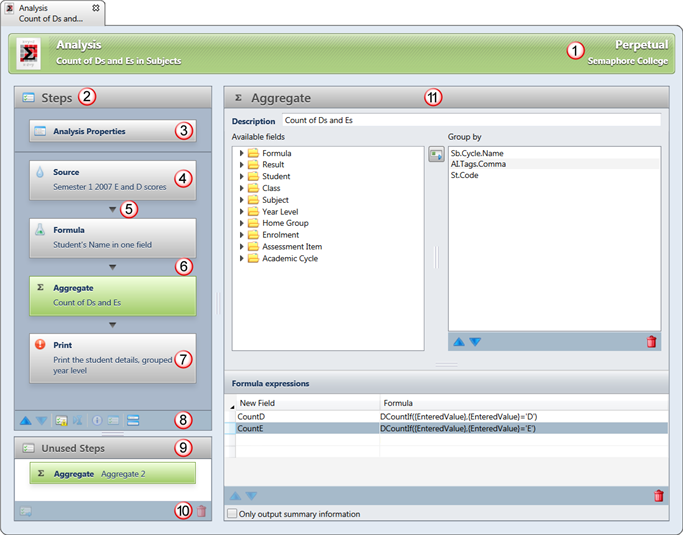
Below is an example analysis in the Analyser window, with the main features of the window described in the table below.
# |
Feature |
||||||||||||
|---|---|---|---|---|---|---|---|---|---|---|---|---|---|
1 |
The title bar displays the name of the analysis, as found in the Analysis Properties. Also, in the far right of the title bar, Perpetual is displayed as analyses do not belong to a particular academic cycle. Once in the database, they may be run from any cycle, even if accessing data from cycles other than the ones currently selected in the Academic Cycle Selector. |
||||||||||||
2 |
The pane on the left side is where all of the steps of the analysis are set up, with the Analysis Properties always appearing at the top of this pane. The Analyser works by flowing data through a number of special operators, always starting with a Source operator, and ending with either a Print or Export operator. In between there may be a number of intermediary or advanced operators ie they require upstream and downstream dataflow. The intermediary operators may be moved up and down so that they are executed in a different order when the analysis is run, depending on your analysis needs. |
||||||||||||
3 |
Every analysis has the Analysis Properties step. Clicking on this will display the properties of the analysis - its name and description, and any parameters that have been set up. Parameters are placeholders so that, when the analysis is run, the user may specify the values that are to be inserted in place of the parameters. For example, a CurrentYear parameter may be inserted so that the same analysis can be run for every different year, without having to open it and make changes each year. The parameters are only used when an analysis is run from the Analysis Explorer and not if run from within the Analysis window. In the Analysis window, the default values stipulated in the parameters are used automatically. |
||||||||||||
4 |
Every analysis has a Source operator as its starting point. It is always positioned as the first of the operators, below the Analysis properties step, and may not be moved. The Source operator provides the raw stream of data from the database. It is where you define:
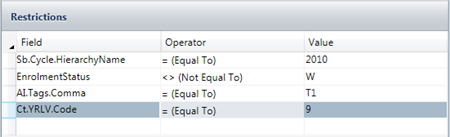
For example, as shown below, four restrictions have been added and each result must meet all four conditions, ie it must belong to 2010, the student must not be withdrawn from the class, the assessment item must have a T1 tag, and the student's year level cohort group must be 9. If any of these restrictions are not met, the result will not be extracted.
|
||||||||||||
5 |
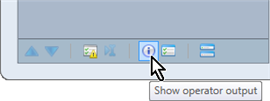
When an analysis is run, you may view the output data from any operator by:
|
||||||||||||
6 |
There are 5 intermediary operators. They all require upstream and downstream dataflow: input from and output to other operators.
|
||||||||||||
7 |
One of the following operators must always be the end point for an analysis:
|
||||||||||||
8 |
|
||||||||||||
9 |
The Unused Steps pane does not appear unless there are unused steps. Where an operator has been inserted in error or has been set up but not currently needed, it may be moved to the Unused Steps pane by clicking the Move to unused icon. From there, any unused steps may be deleted if not required, or moved back into the Steps section if or when they are. This pane allows you, for example, to have an analysis with both a Print and Export operator set up, with the one currently required appearing in the Steps pane and the other sitting in the Unused Steps, until required. You cannot set up the parameters of unused operators as they must be connected to an input dataflow. They must be moved back to the Steps section to display their details and to set them up. |
||||||||||||
10 |
The operator is not just marked as deleted, but will disappear immediately. On saving the analysis, it will be deleted permanently. Operators may only be deleted from the Unused Steps pane. To delete an operator from the Steps pane, you must move it first to the Unused pane and then click the Delete icon. |
||||||||||||
11 |
The large pane on the right side of the Analyser window displays the details of the item currently selected in the Steps pane.
|
 Data from one operator
 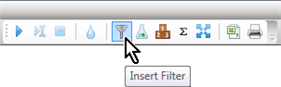 Optionally, after a Source operator, intermediary operators may be inserted, used for analyses that need more than the extraction of raw data. The operators you use will depend on what processes the data must go through, whether it needs to be aggregated, a formula added, etc.
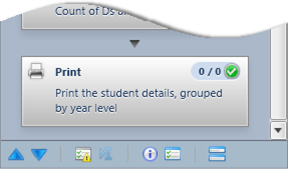 The toolbar at the bottom of the Steps pane contains shortcut icons for procedures that may be performed on the operators in the Steps pane:
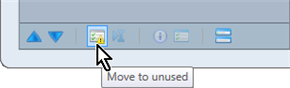
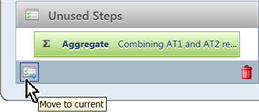 The toolbar at the bottom of the Unused Steps pane contains icons to: