Some schools wish to present a student's results in their reports in a graphical manner rather than use a letter or word to report a student's grade. For example, a teacher may enter a High, Medium or Low value to represent the student's work habit result, but its reported value is shown as a tick in the appropriate column on the printed report, as shown below.

Accelerus allows you to present results graphically in this way, using symbols, but to do so you must:
| • | Set up your marking schemes so that they contain special control characters in the Reported Value field. |
| • | Set up the actual report template in a particular way. |
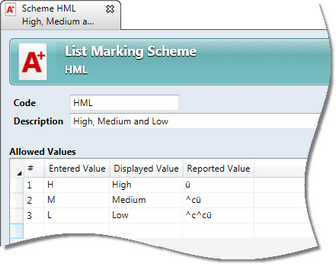
The tick example above used a list marking scheme coded HML shown below. Rather strange hieroglyphics appear in the Reported Value field but these all have a very specific meaning. They are the characters that determine the spacing of the symbol character and the actual symbol character to be used.

Note that if you have defined any Exceptional Values in the marking scheme, eg NA, UG, you should also set up their reported values appropriately, using spacing and symbol characters.
When representing results graphically, you do not print every student's result in the exact same place, eg if a student receives a H grade, the tick should be inserted under the High heading, but it should be moved under the Medium heading if the result is M, and so forth. Therefore, you need to indicate the spacing you want to include for each result, usually columns or tabs, where applicable. There are a number of keystrokes to use to signify spacing characters:
The ^ character is usually found above the 6 key on the keyboard. The list marking scheme shown above uses the scale High, Medium, Low, and represents students' results as ticks. In the H row's reported value field, just the symbol for a tick is entered, as outlined in the Symbol characters section, but in the M row, a column jump precedes the tick symbol. In the L row, there are two column jumps. These will ensure that the ticks print in the appropriate column to be set in the template.
|
In the example HML marking scheme above, the ü character shown in the reported value field for all values actually represents the tick symbol. These symbols can be created in two ways, the first being via the numeric key pad. The alternative is via Character Map. Using this method, you hold down the Alt key and keep it held down, while you enter the appropriate numeric key sequence using the numeric key pad on a keyboard. On releasing the Alt key, the symbol character's representation is displayed. For example Alt and the numbers 0252 create ü. You must use the numeric keypad to enter the numbers when inserting these special character keystrokes. On a laptop that does not have a numeric keypad, function keys need to be pressed to activate this, and the numbers displayed in small text on certain alphabetical keys then act as a numeric keypad. You can use whatever symbol you wish to use to represent your results in the printed reports, although ticks, tick boxes and crosses are the most common ones used, as outlined below:
|
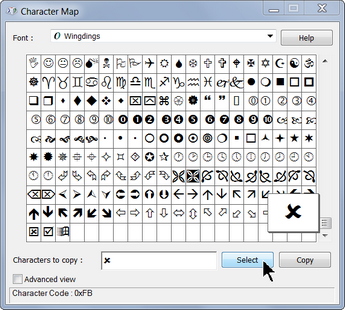
The graphical characters above are not the only ones you may use. Any symbol character can be represented on a report. You need to either know the keystrokes to create them or follow the instructions below which use Windows Character Map. Window Character Map is found on most computers and contains all of the different characters found on the computer although, in most cases, those in Wingdings are used.
Ensure that you do select a font that is usually found on most computers, eg standard Wingdings. Otherwise, when reports are printed errors will occur if the font cannot be found.
|
When you are using a graphical marking scheme, you must follow a few extra steps when setting up templates so that the special characters you have set up in your marking scheme print out correctly. These vary slightly depending on whether the marking scheme uses Tab to move between values or uses table columns.
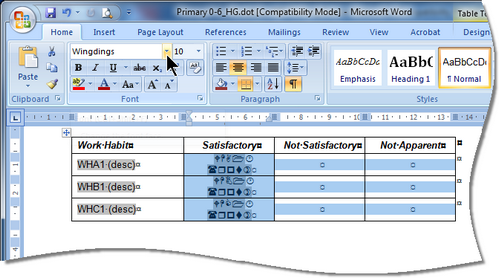
Using the example of a Satisfactory, Not Satisfactory and Not Apparent marking scheme, as shown below, three columns are required for the values.
The field that is inserted is the reported value field, ie the one that displays (rpt) after the assessment item code.
The template, therefore, would appear as seen here, at this point.
The assessment item fields will be converted to a series of symbols which, at print time, will be translated in accordance with the special characters found in the marking scheme.
|


