The five predefined calculations that are available in Accelerus, which do not apply on a student-by-student basis but involve class or subject level input, are only available for numeric assessment items. These calculations are:
| • | Mean |
They use the raw scores from specified assessment items and store the calculated or moderated result in another item. These results are then available to use in other calculations or to include in student reports.
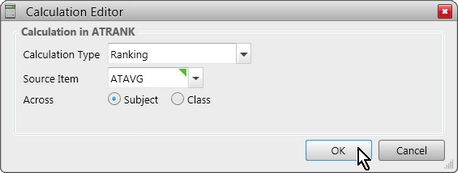
Where these calculations are referencing results that are blank, contain errors or special values, ie NA, ABS or UG, these are ignored. For example, if there are 30 students in the class, but only 25 have valid results, the Count function will only record 25, and rankings will go from 1 to 25 only, and so forth. The students with non-valid results will have the calculation error text assigned as their result, eg ERR.
Where any of the above functions are used to calculate results across subjects, teachers will not immediately see the calculated results, when working off line in their classes. This is because the calculations rely on all results for the subject and not just those in the teacher’s class. These across-subject calculated results will be displayed in the class file after the teacher updates the class into the Accelerus database. The results displayed, however, will only reflect those saved in the database so far for the subject at the time the teacher updates. and may not be the final calculated scores.
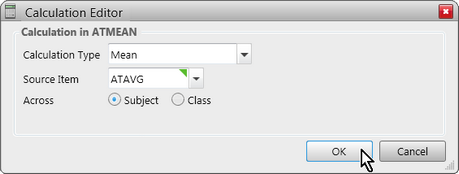
This calculates the mean or average for a class or subject, based on the results of students for a particular assessment item. All students in the class or subject, as selected, will have the same mean. Therefore, while the mean is not really a result of each student, but of the class or subject, it must be treated as a result of the student in order to be available for insertion in each student’s report. The Mean function only uses valid results, excluding any students with blanks or any exceptional values that have been defined for the numeric marking scheme for the source item, eg NA. To set up a Mean calculation:
Only numeric assessment items will be available for selection.
|
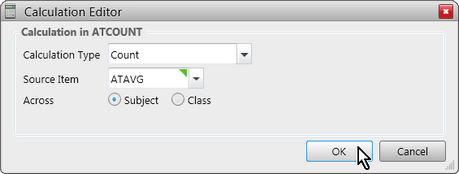
The Count function counts the number of valid results for an assessment item for a class or subject, excluding any blanks or any containing exceptional values defined in the marking scheme of the source item. Count is mainly used when ranking students, where you may want an out of value, or count of the number of students being ranked, eg Rank 13 out of 65. To set up a Count calculation:
Any type of assessment item may be counted, not only numerics, with this function.
|
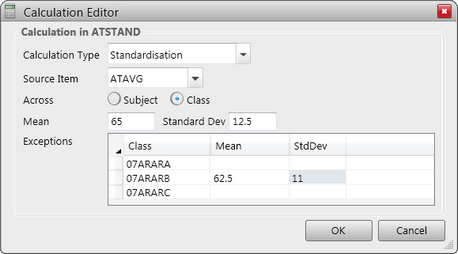
A Standardisation calculation takes a set of raw numeric results for a class or subject and normalises these to a specified mean and standard deviation. To set up a Standardisation calculation in an assessment item:
Any class rows left blank will use the subject mean and standard deviation.
|
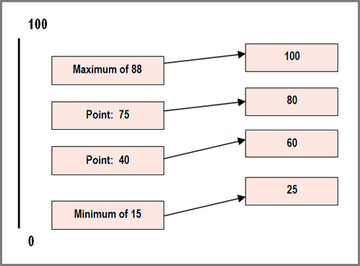
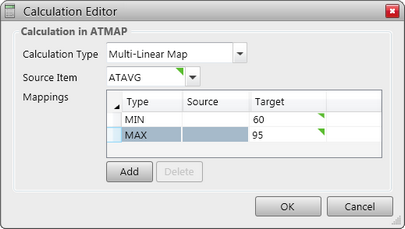
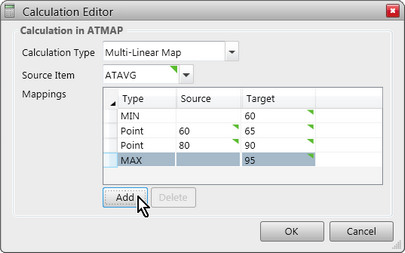
Multi-linear mapping allows you to set the minimum and maximum results for students in a subject and have students’ results recalculated or mapped to other values, according to their relative positions within the minimum and maximum. Optionally, multiple interim points may be mapped within the minimum and maximum. For example, you may have an assessment item in which the possible result range is 0 to 100. The actual results of students in the subject, however, range from 15 to 88 – the minimum and maximum achieved results, respectively. You want to map these actual or raw results to another minimum and maximum – say, 25 to 100, so that the students whose result was 15 will now have a mapped result of 25 and the ones with 88 will have 100. You may also want to set two mid-points along the way, mapping 40 to 60 and 75 to 80. This means that there are, in effect, multiple linear mappings – 4 sets in this case. Other results will be mapped within these ranges according to their relative positions, within each of these mappings.
To set up a Multi-Linear Map calculation:
However, once results for the item have been entered or synchronised back into the database, on re-opening the calculation, the current minimum and maximum values stored in the database will be displayed.
|
