|
Graphic functions are an advanced Accelerus feature and usually need to be set up by Accelerus staff, on a fee for service basis, although some commonly-used examples are available on the Accelerus website. Assistance with customising the available examples and setting up graphic functions is not covered under a school's Accelerus support agreement. If schools have particular graphical needs, Semaphore Consulting is happy to provide a quote. |
While the graphical marking scheme processes allow you to produce a graphical translation of the student data to print on reports, such as ticks and crosses, these are text translations, making use of fonts such as Wingdings.
A much more powerful option available in Accelerus uses graphic functions which convert data into drawings or pictures, as shown in the three examples below.
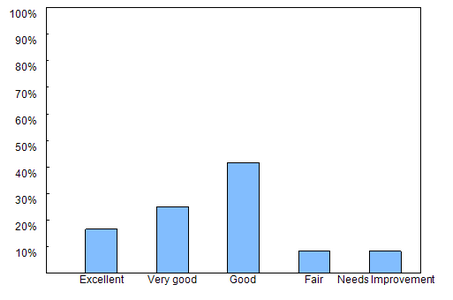
This first example, shows the distribution of achievements in a particular assessment item across the whole subject, represented in a bar graph.
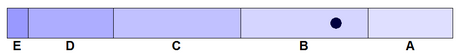
This second example, shows one of the ways a student’s performance may be plotted in relation to the distribution of results across the class, in this case in a 15 point scale which translates to A to E scores.
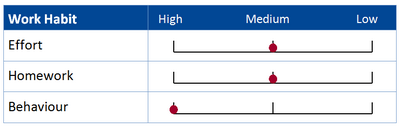
In this third example, a single student's performance in three work habit assessment items is shown graphically.
The graphic functions are defined in an XML file. This contains the instructions for converting the input data into the desired graphic output which consists of one or more graphic elements, eg circles, rectangles, lines and text. Each aspect of each graphic element can be either a set value or a formula. If the formula is based on the input data, the graphic output varies according to the input data.
Graphic functions are imported into the Accelerus database, via File > Import > Graphic Function.
Once imported, they can be used in custom calculations in assessment items. Usually two assessment items are required: one that contains the raw data and one that converts and stores the raw data in a graphical format. The assessment item that stores the graphical representations must use a comment-type marking scheme that has an unlimited maximum number of characters.
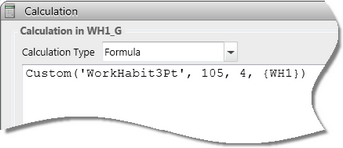
The calculation example below has been added to an assessment item coded WHI_G. It uses a custom graphic function called WorkHabit3Pt. The graphic that is produced by this has a width of 105mm and height of 4mm, and uses the data found in the assessment item WH1. It is actually this graphic function and calculation that has been used to produce the work habit graphic in example three above.